FCDA Web Tool Recipe: How do counties vary in their use of congregate care?
In this series of CQIdeas we introduced the concept of variation and its role in the CQI process. In particular we looked at how group care as a first placement type varies by county within a given state. This FCDA web tool Recipe will show you how to conduct that analysis for your own state. If your state is not a Data Center member, read on anyway; the approach to this analysis will still apply to your system.
This Recipe will take about 5 minutes to complete. In addition to the FCDA web tool, you will need access to Microsoft Excel.
Question: How does first placement in congregate care vary by county in my state?
- Start on the All Spells page. Under County, select All Counties. This directs the system to retrieve foster care spells from your entire state.
- In the Spell overview section, under Admission type, select First admission. This instructs the system to only return spells of children entering care for the first time.
- Scroll to the Sample selection section. Under Entry cohort, enter 01-01-2010 in the From box and 12-31-2010 in the To box. This limits the query to children entering care for the first time in 2010.
- Scroll to the Define output section and click Download data.
Your results will open as a .csv file in Microsoft Excel. It should look like this:
- Open a new tab in your Excel workbook. Click your mouse somewhere in the new sheet and insert a pivot table. When asked to select the data for the pivot table, flip back to the source data tab and select all of the columns in the downloaded data set.
- The pivot table field list will appear to the right. Drag the variable CNTYNAME (county name) into the Row Labels box, drag the variable PLACE1 (first placement type) into the Column Labels box, and drag PLACE1 again into the values box.
The resulting table shows you the number of children in each county that experienced a first placement type in foster care (PFC), kinship foster care (PKC), congregate care (PCC), and other (POT).
- Then, click on Count of PLACE1 in the Values box and select Value Field Settings.
- In the box that appears, go to the Show Values As tab and select % of Row Total. Click OK.
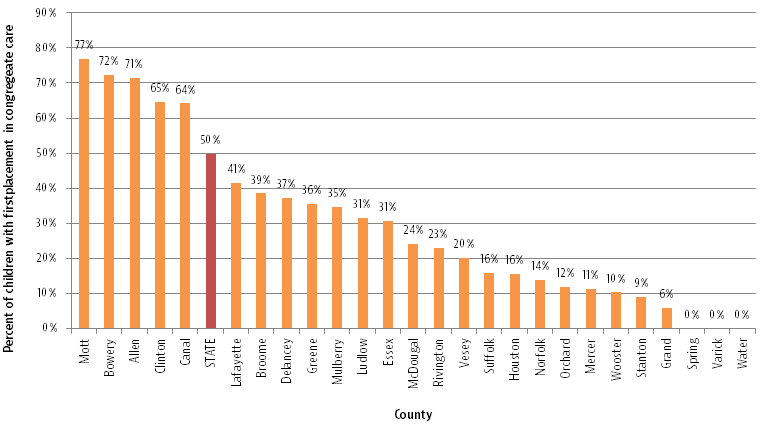
Now the table shows you the percent of children in each county that experienced a first placement type in foster care (PFC), kinship foster care (PKC), congregate care (PCC), and other (POT). You can use Excel to chart these outcomes. Using my sample state, the chart below shows the percent of children in each county that experienced a first placement in congregate care:


