Webinar Recap: CFSR Reviews — Measures and Methods
On May 5th and May 9th, in partnership with APHSA/NAPCWA, Casey Family Programs, and the Annie E. Casey Foundation, The Center for State Child Welfare Data presented a national webinar on the newly proposed CFSR 3 measures. In this session, Data Center Director Fred Wulczyn provided a high-level overview of the new measures, discussed the proposed methods for setting national standards, baselines, and targets, and highlighted issues for states to consider as they prepare comments to the Children’s Bureau. A recap of the content appears below. To watch a recording of the session click here. To view the slides, click here.
New measures: A high-level view of the changes
First and foremost, it is important to acknowledge that the proposed measures represent a substantial improvement over their predecessors. The science of measuring child welfare system performance has evolved considerably since the CFSR was first created, and the new measures reflect a much better alignment with what the field now considers to be best practices.
The domains that the new measures address are essentially unchanged and, for the most part, the revisions to the calculations enable a more accurate and representative view of system performance. In particular:
Maltreatment in foster care: The expanded definition of perpetrators provides a more comprehensive picture of children who experience maltreatment while in foster care. The new method of examining incidents of maltreatment per care days used is also an improvement in that it accounts for the fact that exposure to foster care (i.e., length of stay) varies from state to state.
Recurrence of maltreatment: The definition of recurrence has been expanded from repeat substantiation to re-report. Although the new method may represent a stricter definition of recurrence, it is an appropriate response to evolving practices in the field regarding differential response and other alternatives to traditional investigations.
Permanency within 12 months by entry cohort. This measure reflects ACF’s commitment to using entry cohorts, which provide more representative information about outcomes for children than the point-in-time and exit cohort measures used in the past. Rolling all permanency options into one outcome (instead of focusing separately on reunification, adoption, and guardianship) is another strength; this method focuses system improvements on permanency in general, leaving it to the state and its local partners to determine whether it is achieving the right mix of permanency outcomes given the needs of its particular foster care population.
Permanency for children in care for two years or more. This measure reflects an attempt to account for the state’s long stayers. Because this measure examines the population of long stayers in care on a certain day, it does not tell us much about the trajectories of children who become long stayers. Therefore, in addition to tracking this new indicator, we would encourage states to maintain the entry cohort approach and examine trends for achieving permanency within 18 months, 24 months, 36 months, etc.
Placement stability: As in the case of measuring maltreatment in care, the new measure of placement stability accounts for exposure to foster care by examining the number of placement moves per care days used. That is, the new measure accounts for the relationship between instability and exposure to foster care and the fact that exposure (i.e., length of stay) varies from state to state.
Re-entry. The new measure asks an essential question about re-entry: Of children who come into foster care, what is the likelihood that they will come into care again? Some have asked whether it would make more sense to examine re-entries from an exit cohort. This is a different but equally important question; we would encourage states to monitor both.
National standards: Performance with respect to the national average
Another way in which the CFSR3 proposal reflects best practices is in its method for setting national standards. Core among these is the introduction of risk-adjustment. Put simply, in previous rounds, the state-to-state comparison assumed that states were similar to one another. We know, however that this is not the case; states vary widely in terms of the size of their foster care populations, case mix, and rate of entry into care, among other things. By controlling for these variables, risk-adjustment enables more of an apples-to-apples comparison between states.
The proposed method establishes risk-adjusted state performance relative to a national average. The method goes by a number of different names—multilevel model, random effects model, hierarchical model. All of these are based on the same mathematical principles. They are highly adaptable, very powerful, and used widely in the fields of health care and education.
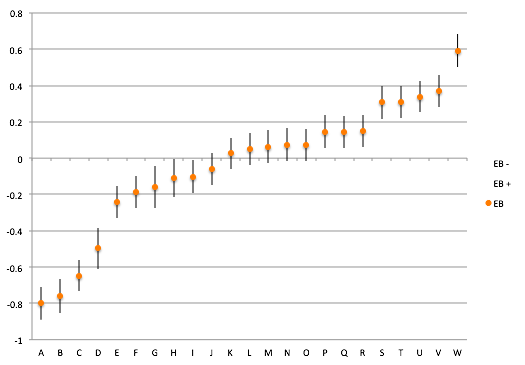
The graph below is an example of what the between-state comparison might look like. The horizontal “zero” line on the vertical axis can be interpreted as the national average—the outcome for all children in all states considered together. The orange dot represents the state’s risk-adjusted performance. The bar around that dot reflects our certainty about whether the state’s performance is statistically different from the national average. States whose bars cross the “zero” line are classified as performing at around the national average; states whose bars fall completely below the “zero” line are those that perform significantly below the national average; and states whose bars fall completely above the “zero” line are those that perform significantly above the national average.
The Federal Register invites comment about what variables should be included in the risk-adjustment. The aim here is to suggest variables that have a significant influence on outcomes for children and families. Below we list a handful of variables that we believe are important to consider:
- Child’s age at admission
- Entry rate per 1,000 children (because states with higher admission rates often have higher exit rates)
- Re-entry rate (We may want to balance an assessment of time to permanency against an assessment of re-entry to care.)
- Policy context (For example, we may want to consider whether a state’s child welfare population includes youth in the Juvenile Justice system.)
In general, we would recommend parsimony in suggesting variables for inclusion in the model, as the nature of these models is such that once you have accounted for the most powerful drivers of variation in outcomes, entering additional variables makes less and less of a difference (i.e., less of an adjustment to the outcome on which states are being compared).
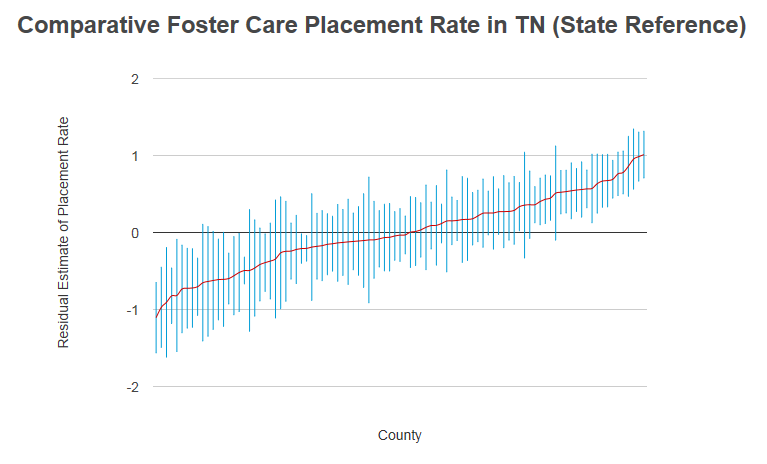
Another advantage of this method is that it is easily adaptable at the state level for (a) evaluating relative performance of counties, private providers, or other administrative units, and (b) evaluating variation on outcomes over and above those required by the CFSR. For example, the graph below represents the same type of information as the graph above except, in this case, the outcome is “Placement Rate per 1,000 children” and each bar represents the risk-adjusted performance of each county inside Tennessee with respect to the state average. The figure underneath the graph maps those findings, shading counties to classify them as either performing at, above, or below the state average. (Note to Data Center member states: This function coming soon to the FCDA web tool.)
Baseline and target setting
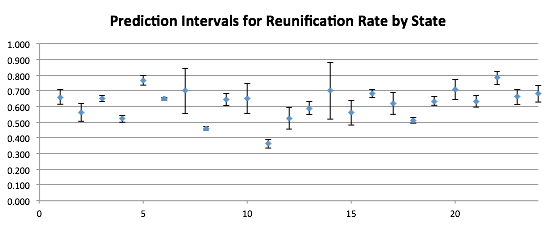
Finally, another important change reflected in the approach to CFSR 3 is that the methods for setting baseline and target performance show a deeper appreciation for historical performance as a predictor of future performance. In the proposed method, historical performance is used to create an interval outside of which future performance would be considered a significant change. The graph below depicts an example. Similar to the concept described earlier, the blue dot represents the state’s performance; the bar around that dot reflects the range outside of which a change in performance would represent a significant change from past performance. The size of that interval is a function of the size of the state’s foster care population (the smaller the population, the greater the volatility in past performance and, therefore, the larger the range required to detect significant change) and the state’s historical fluctuation on the outcome.

Beyond this, the notice in the Federal Register is unclear as to how the method for setting baselines and targets will actually work. Generally speaking, this is an area in which the science is not fully developed. That is, there are a number of ways in which one could use past performance to set baselines and targets and the science has not yet determined that one particular way is best. We would recommend that interested stakeholders convene to discuss the methods and offer a proposal for wider discussion.
For help with questions or to share feedback, please contact us.


