Using the FCDA web tool to measure reentry to foster care
Over the last year, the Data Center helped deliver a five-part practicum to the Northern California Training Academy on using administrative data to support the process of reducing reentry to foster care. As always, we began the work by showing the participants how to observe the rate of reentry in their specific county, how it compares to the statewide reentry rate, and how reentry varies among children within their own counties. We used the FCDA web tool to help the students make these observations.
The FCDA web tool is designed to promote inquiry – users can pose a wide range of questions about system performance and use the tool to answer them. In this case, we used the tool to create a workbook of pivot tables that answered ten core questions about the likelihood of coming back into care. We based one of these on the CFSR3 measure for reentry:
Of all children who entered care in a given year AND exited to reunification or relative within 12 months, what percent reentered foster care within 12 months of exit?
- Answer this question for your own state or county. Follow the recipe below to conduct the analysis for your own state or county. (Note, this example uses the Multistate portal of the web tool. If you are using a state- or county-customized site, some small changes to this recipe may apply.)
- Check to see if your state is a member of the Data Center. See our current member listing here.
- Stay tuned for more on our reentry practicum in Northern California. Subscribe to the Data Center’s newsletter to learn more about our support to child welfare systems around the country.
Step 1: Download the data
Log into the FCDA web tool and download your state/county’s spell file for the entry cohorts of interest. Keep an eye on the censor date – the date as of which your data are current. Remember, to observe this outcome for an entry cohort, you need a three-year window of time: One year to allow all the children in the cohort to enter care, another year to give them all the opportunity to exit within 12 months, and another year to give them all the opportunity to reenter within 12 months of exit. The graphic below illustrates the requirement. If, for example, your data are censored as of 12/31/2016, then the most recent entry cohort for whom you can calculate this measure is the CY2014 entry cohort.

Step 2: Build the pivot table
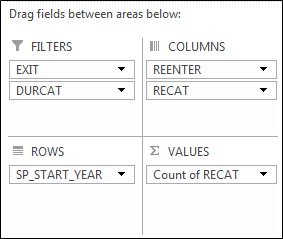
If you are new to pivot tables, click here to review a quick guide. Use the drag and drop functions to build your pivot table using the following variables. (All definitions are available on the Variable Names and Codes page of the web tool’s User Guide.)
- EXIT: How the child exited foster care
- DURCAT: How long the child spent in foster care
- SP_START_YEAR: The year the child started this spell in foster care (the entry year)
- REENTER: Whether or not the child reentered care after discharge from this spell
- RECAT: How long it took for the child to reenter care
Step 3: Filter for the correct denominator
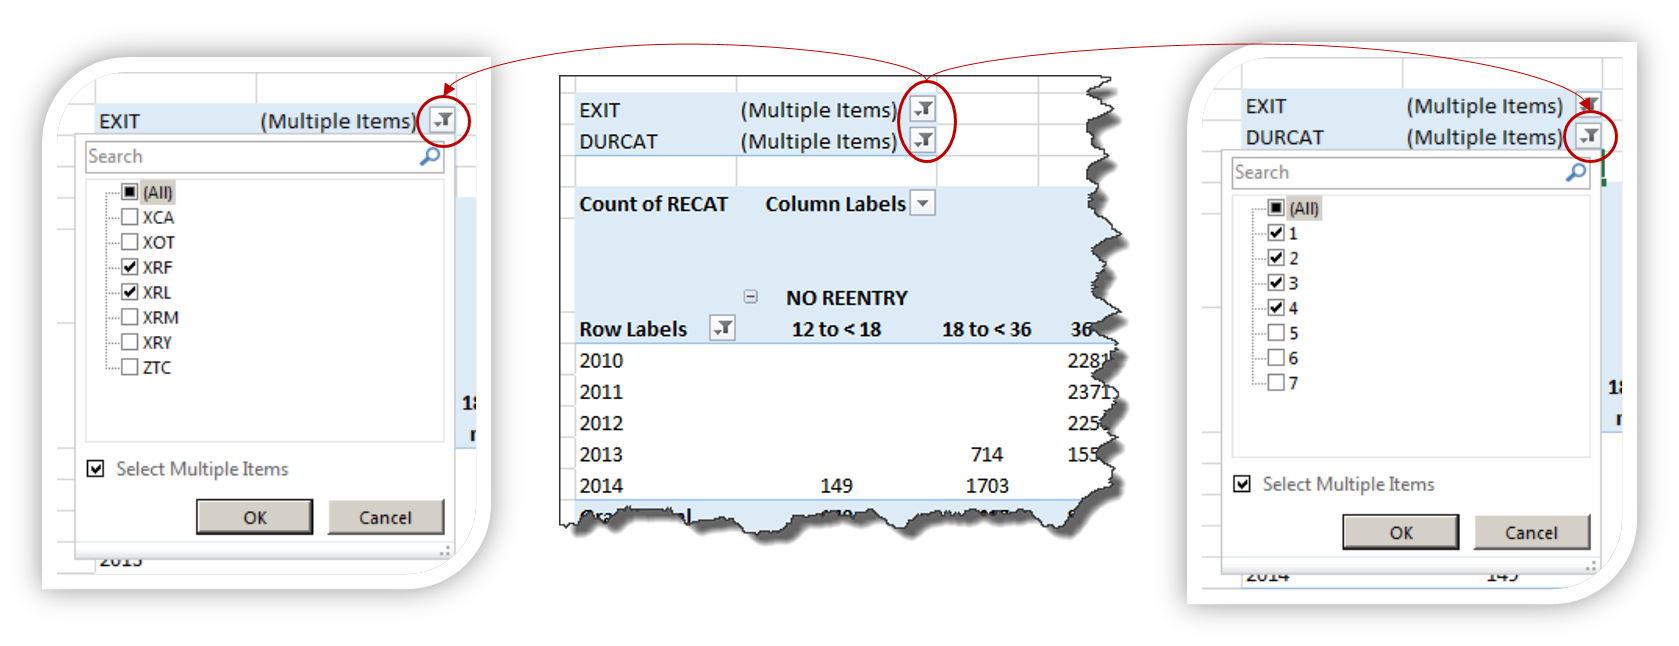
Making the selections above will generate a pivot table that contains two filter variables. Use these to identify the analytic population – or denominator – for this measure. In this case, the denominator includes all the children who entered during the year who exited to reunification or relative within 12 months. Click the filter icons for these two variables and make the following selections:
- For EXIT, select only XRF (reunification) and XRL (relative). This will limit the population to all children who entered during the year who exited to reunification or relative.
- For DURCAT, select only 1 (< 1 month), 2 (1 to < 3 months), 3 (3 to < 6 months), and 4 (6 to < 12 months). This will further limit the population to only the children who exited to family within 12 months.
Step 4: Calculate the numerator and the rate of reentry
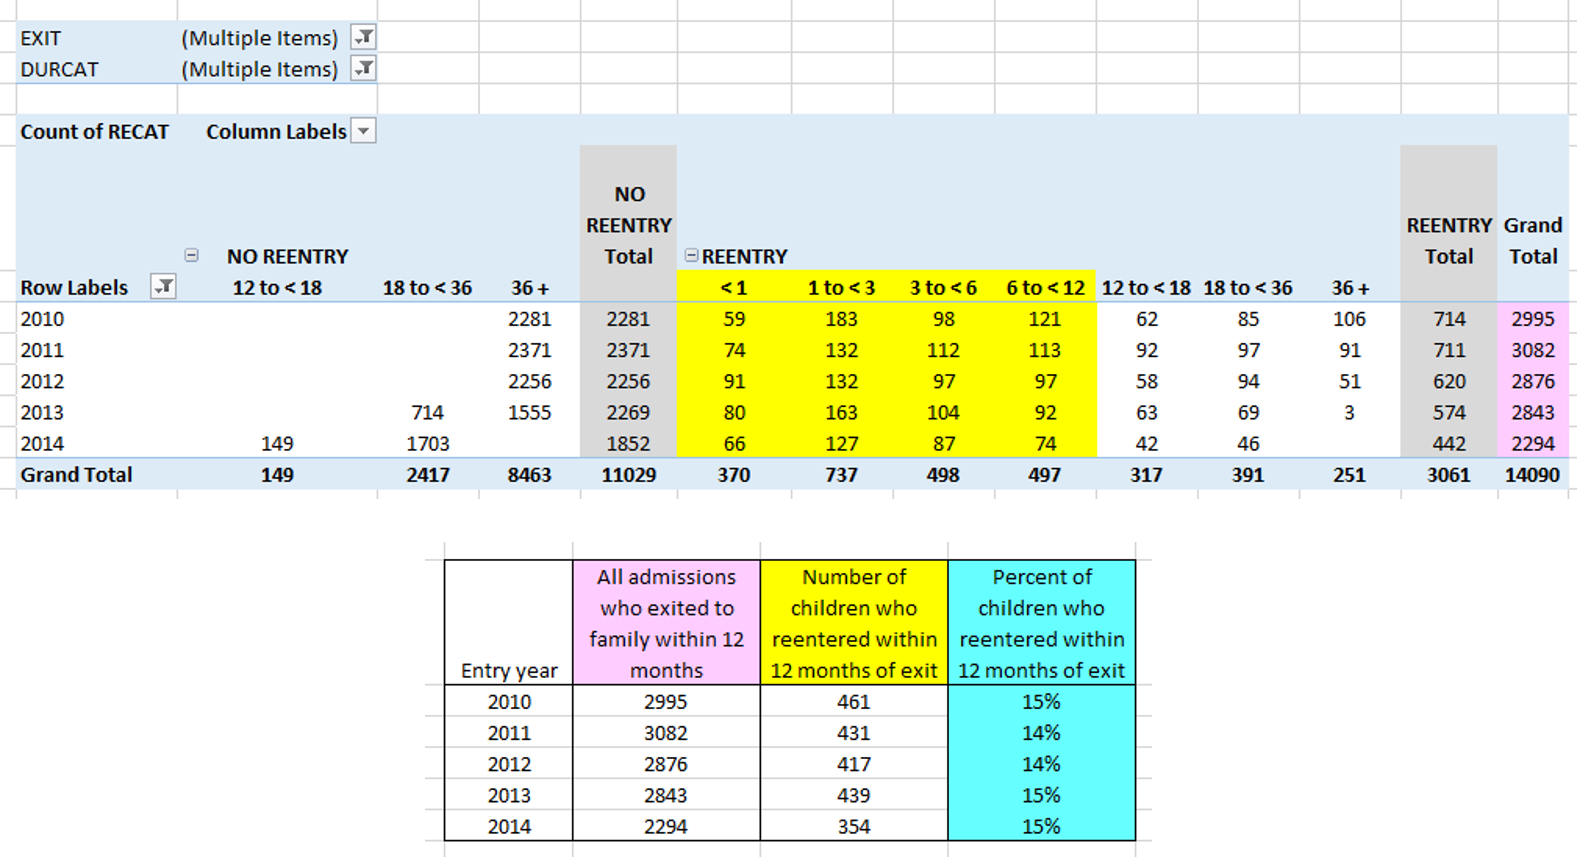
Your resulting pivot table should look like the one below. (For the sake of clarity, in this sample table we have overwritten the FCDA codes with their corresponding meanings.)
The numerator for this measure contains all the children in the denominator who reentered care within 12 months of exit. To find those children, first notice that the pivot table divides the population into children who did not reenter at all (on the left) and children who did (on the right). Looking only at the children who did reenter, identify only those who did so within 12 months, highlighted in yellow in the example below. Summing these columns will give you the total number of children who reentered care within 12 months of exit.
Carry the denominator and numerator into a separate table and use a simple division formula to calculate the rate of reentry. In this example, the reentry rate has hovered around 15% for the past several years.