Variation across subgroups: What subgroups are in my system?
Child welfare outcomes can vary on a number of dimensions: by geography or business unit, by child and family characteristics, by service type, and over time. Below are some examples of statements that describe each type of variation:
Variation by geographic/business unit:
- Among all the contracted service providers in the state, median length of stay in foster care ranges from 62 days for children placed with Provider A to 287 days for children placed with Provider Z.
- Yankees County has the highest rate of maltreatment recurrence in the state, with 5.2% of victims having another substantiated incident of abuse or neglect within six months. Mets County has the lowest rate of recurrence; there, only 2.1% of children have another substantiation within six months.
Variation by child and family characteristics:
- Children who enter foster care as infants stay in care longer than children who enter care at age one or older.
- In State A, African American children come into foster care at a rate of 3.2 per 1000 children in the general population. In contrast, white children enter care at a rate of .7 per 1000 and Hispanic children enter care at a rate of 1.1 per 1000.
Variation by service type:
- Children who enter foster care directly to a shelter experience more placement moves during their spell than children who enter care directly to a foster home or kinship care.
- Children placed with kin stay in foster care longer than children placed in non-relative foster care.
Variation over time:
- Time to reunification for children placed in foster care with the ABC Foster Care Agency has decreased steadily since 2005. Of children placed in 2005, 27% returned to their families within one year; of children placed in 2011, 39% reunified within one year.
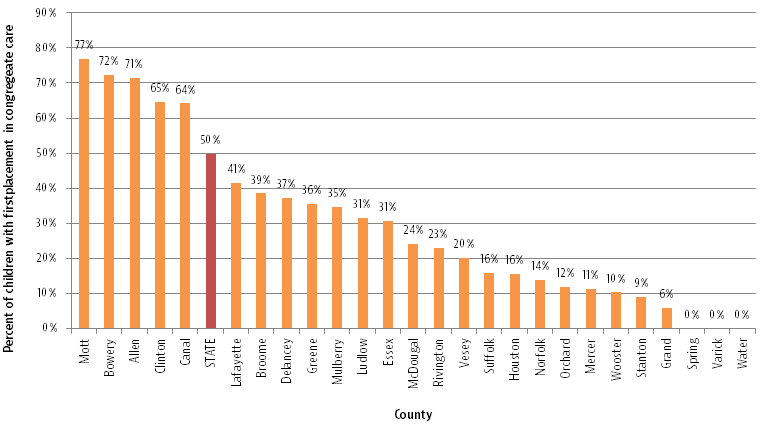
Consider the following example, which explores variation by county. A fictitious state agency is concerned about its use of congregate care for children in foster care. The graph below shows the proportion of children entering foster care in 2012 that had a group care setting as their first placement type.
We can see that statewide, about 50% of children entering care experience congregate care as their first placement type, but we also see that county rates vary considerably around that average. Whereas 77% of children in Mott County entered directly to a group setting, there were three counties where none of the children entering care had that experience.
With this knowledge in hand, we can ask the next question in the CQI process: Why does the use of congregate care differ from county to county? We’ll pursue this question in the next post. To learn how to create this graph for your own state using the FCDA web tool, click here.
